TESSA® APM Oil
Simplify the oil analysis of your transformers with our software solution
An aging transformer fleet combined with long delivery times requires electrical network operators to understand the exact condition of their assets in order to initiate life-extending measures in time.
Oil analysis is a reliable and widely used method to check the condition of transformers. During the regular analyses, a lot of measured values accumulate, which have to be archived sustainably and processed in a comprehensible way.
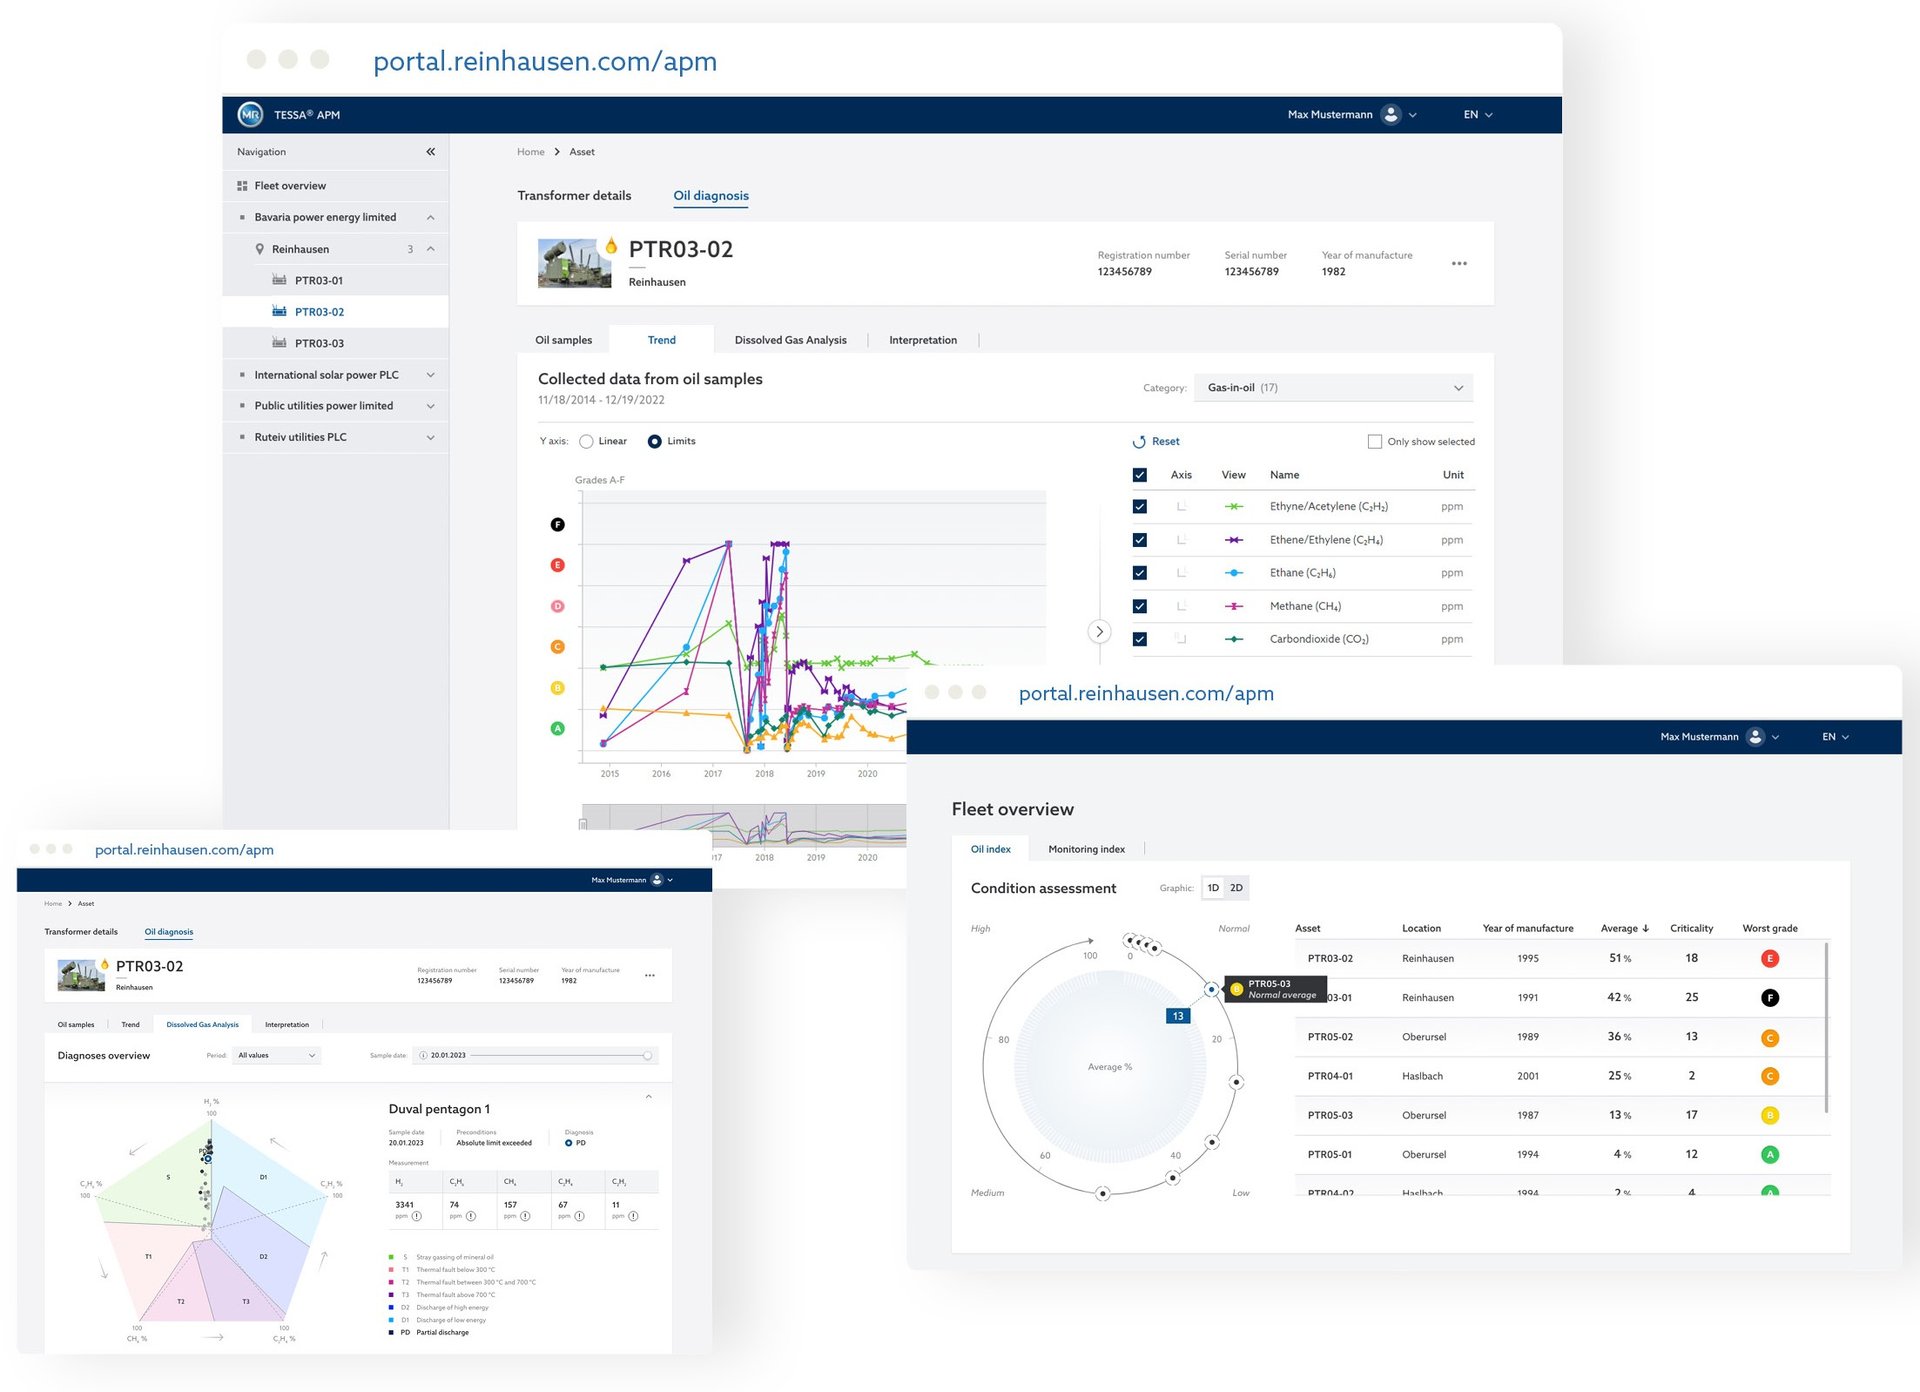
TESSA® APM Oil supports you in this process and stores the laboratory sample data in a structured way, performs the analysis and provides actionable insight according to industry standards automatically. Our digital solution displays the condition of your asset fleet down to the individual measured values in a clear and comprehensible way. This enables you to make the right decisions for your transformers.
Your Advantages at a Glance
-
Transparent and clear assessment according to industry standards
-
Extension of the asset life cycle and improvement of operational reliability
-
Better basis for decision making based on comprehensible analyses
-
Major time savings through process automation
Product Information
Select language
Select language
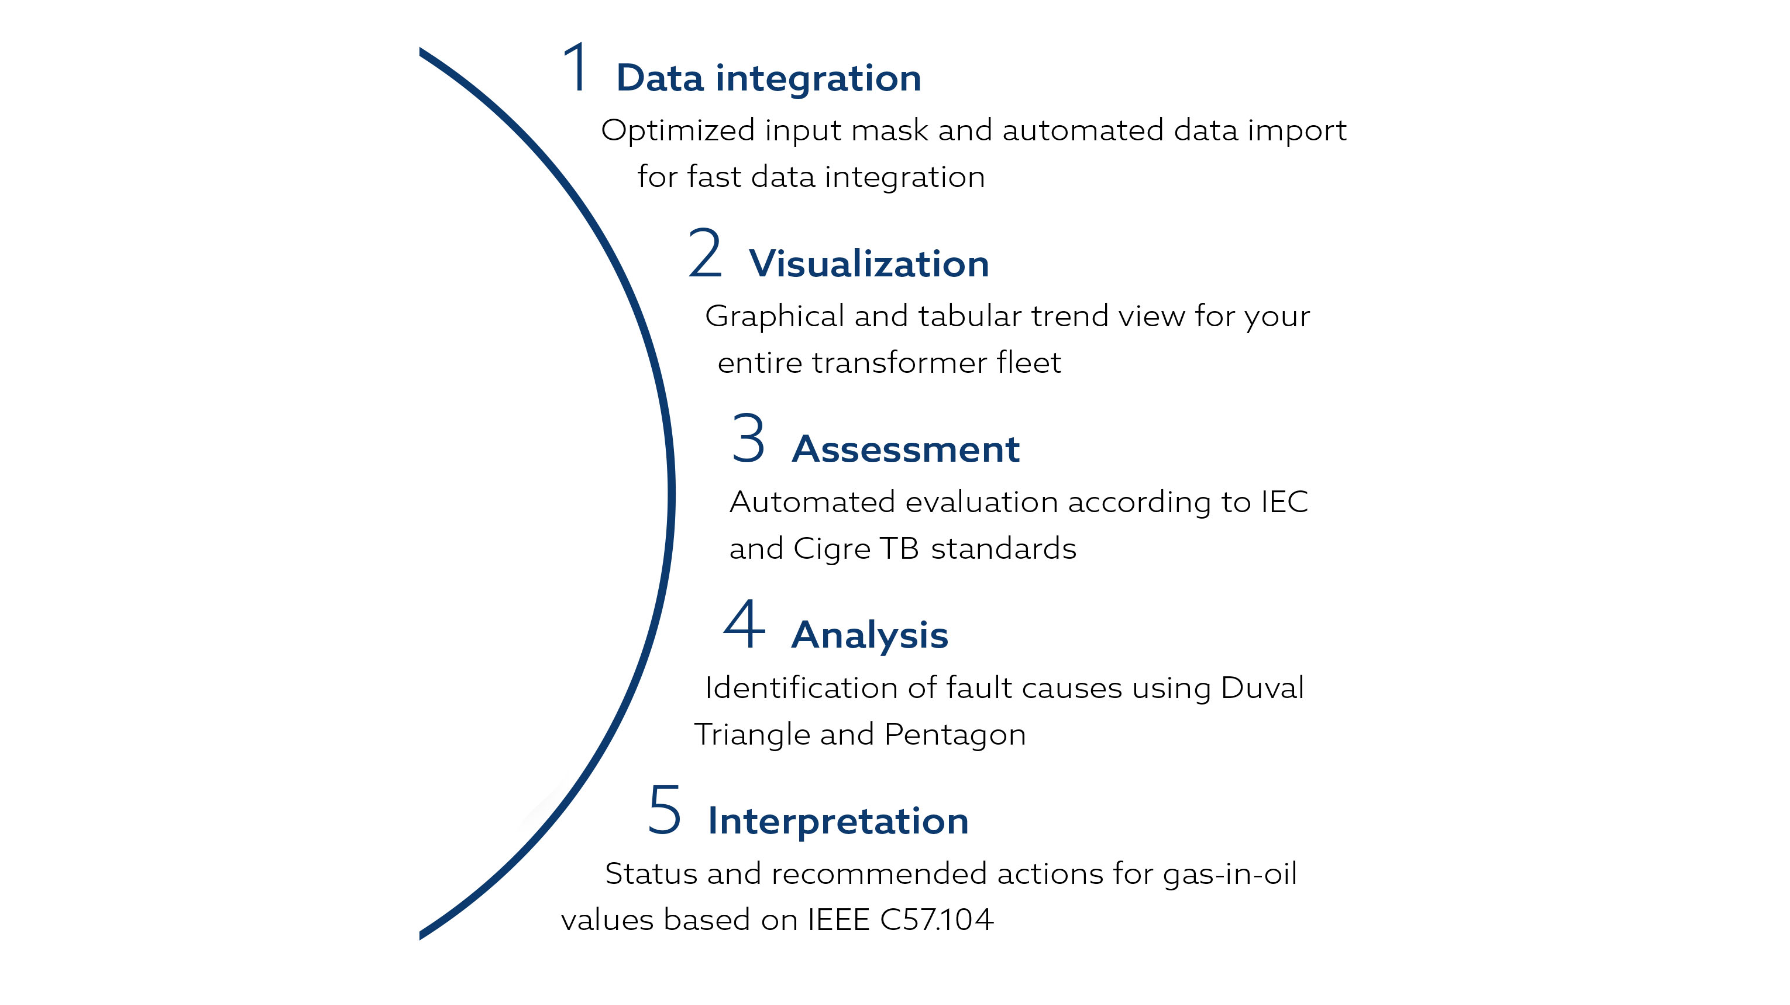
1. Data integration
1. Data integration
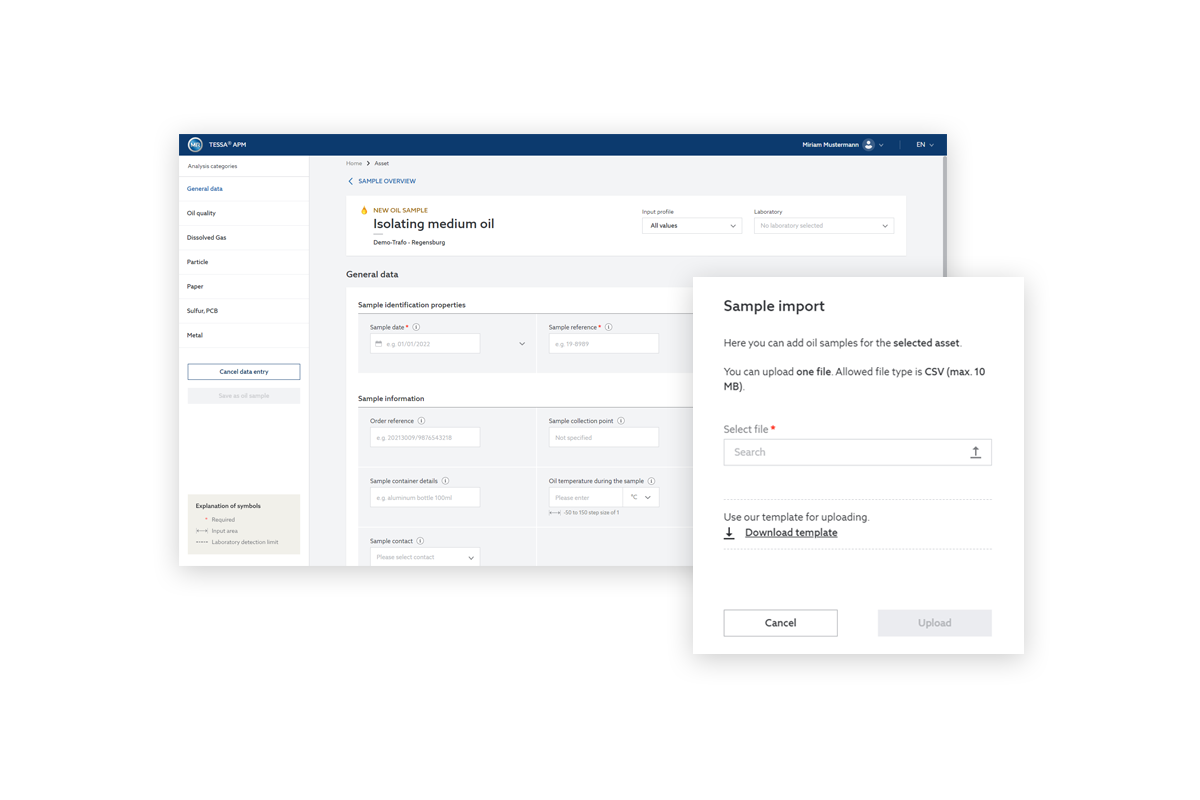
Manual data entry
- Clear input structure through the division of input categories and meaningful subgroups
- Input fields are based on the measurement methods with additional specification of the corresponding standard
- Input fields are reduced by selecting the appropriate input profile
- Validation of input and detection limits
Sample import
- Data import via a CSV template
- Fast integration of multiple oil samples
- System feedback during the import process
- Validation of input and detection limits
2. Visualization
2. Visualization
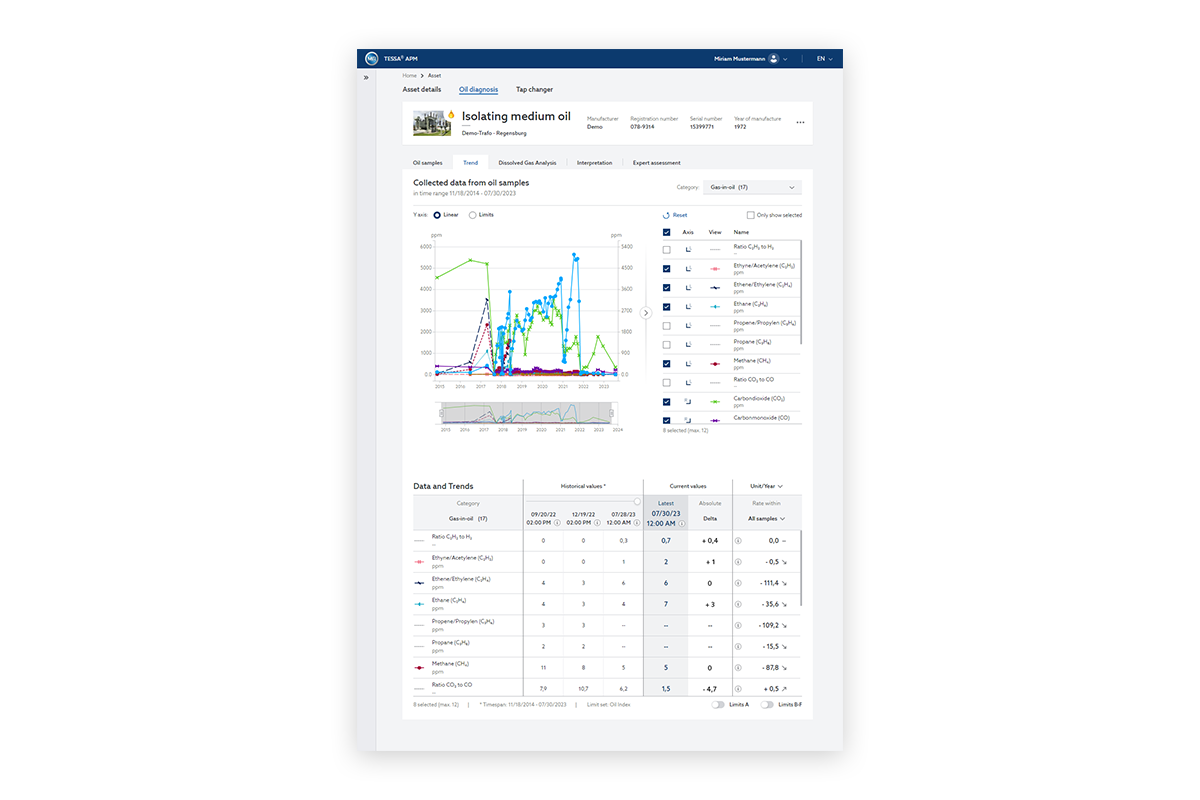
Graphical view
- Detailed analysis of the historical course
- Individual selection of measured values, axes and time period
- Enlargement of the line chart for the analysis
Tabular view
- Display of the history, the deltas and the rate of increase over different time periods
3. Evaluation
3. Evaluation
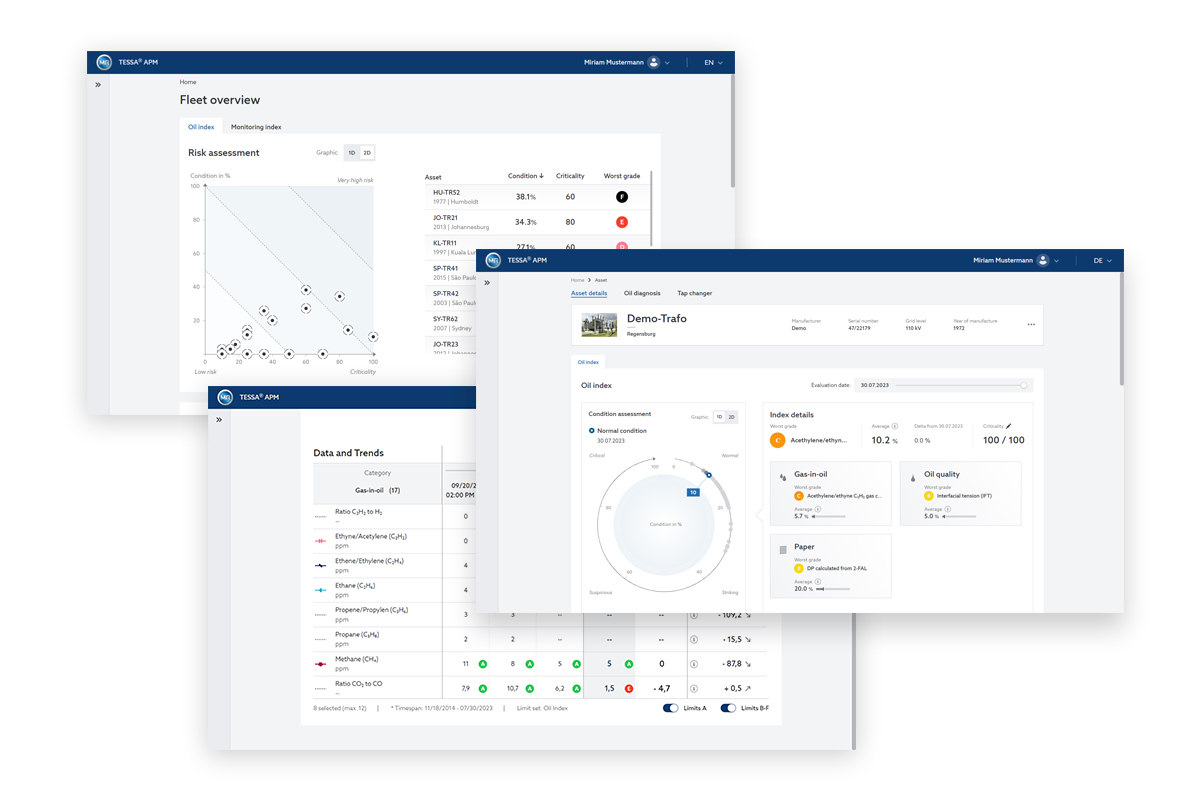
- Condition ranking of the entire plant fleet, taking into account criticality and additional indication of the worst measured value
- Oil index based on the categories gas-in-oil, oil quality and paper
- Historical overview of the condition development of an individual transformer and its categories
- Details on the parameters and calculation of the grade
- Advanced visualization of the grade and the respective thresholds
- Standards-based evaluation of mineral oils according to IEEE C57.104, IEC60599, CIGRE TB761, ASTM D3487-16, IEEE C57.637, IEC60422
- Standard based evaluation of ester and silicone oils
4. Analysis
4. Analysis
- Evaluation based on IEEE C57.104 from 2019
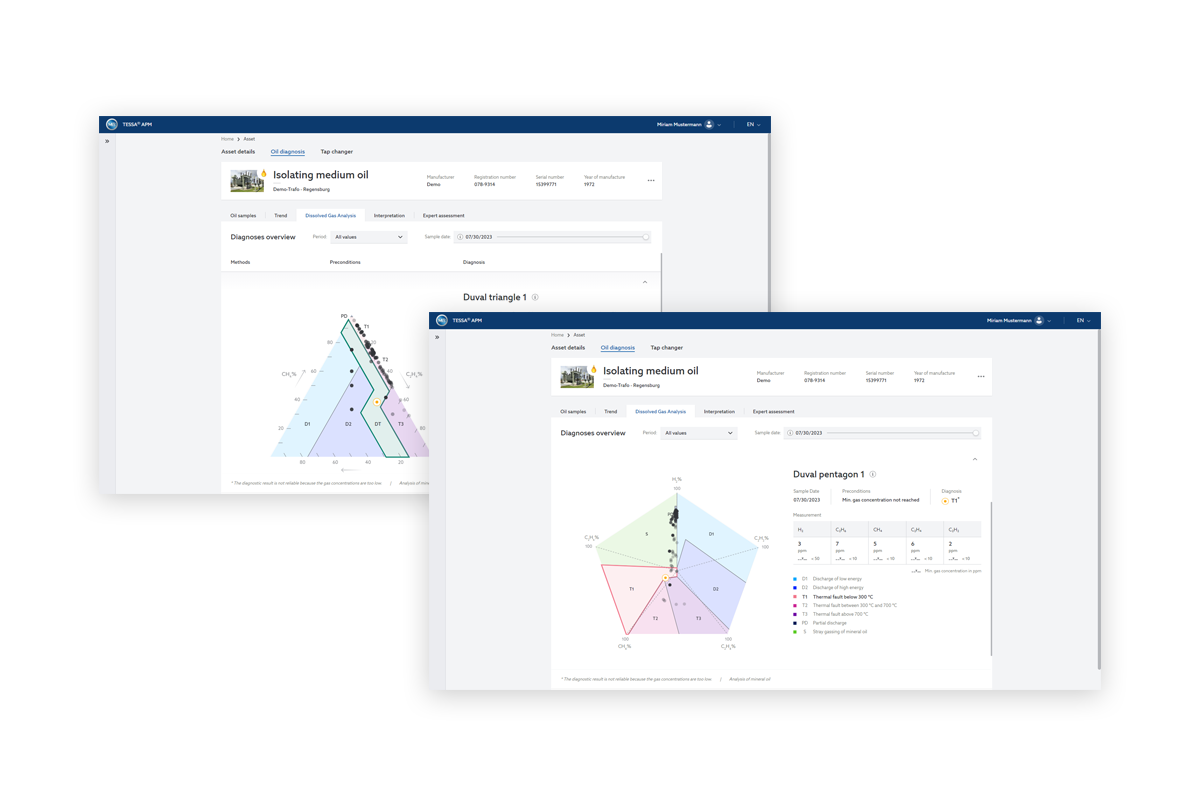
- Identification of failure causes using Duval Triangle 1, 4, 5 and Pentagon 1, 2
- Current status of gas-in-oil analyses at a glance
- Historical view of analyses and measured values
- Facilitated classification of the error pattern by evaluating meaningful limits
- Explanation which analysis procedures are relevant
5. Interpretation
5. Interpretation
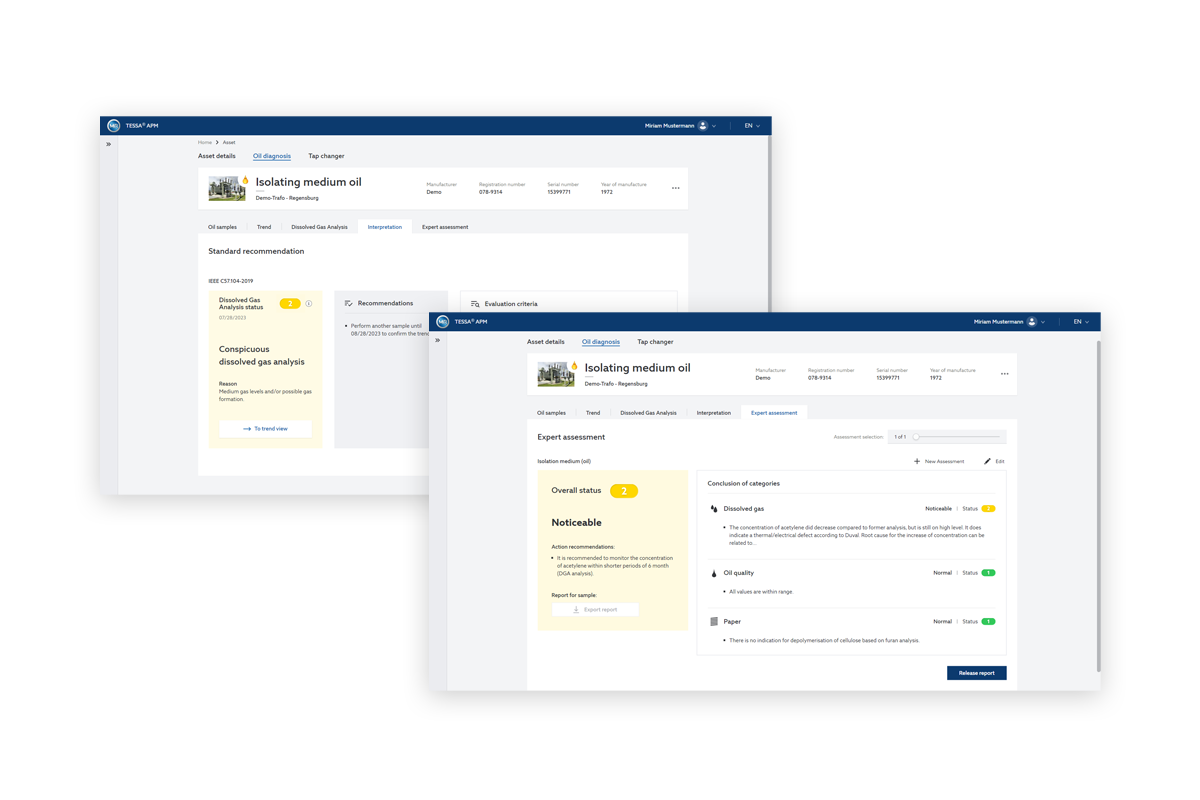
Standard recommendation: automated interpretation
- Status and recommendations for action based on 90- and 95-percentile consideration (IEEE C57.104) of dissolved gas-in-oil concentrations
- Consideration of transformer characteristics (year of manufacture, oil expansion system)
- System feedback in case of missing input or norm violation
Expert recommendation: diagnosis based on interpretation
- Historical consideration of ratings in categories: recommended action, gas-in-oil, oil-quality, paper, and metal
- Report generation with recommendations by an expert
- Customizable report layouts based on customer requirements

